Using diagnostic
classification models
to Improve Instructional Decision-Making
Acknowledgements
The research reported here was supported by the Institute of Education Sciences, U.S. Department of Education, through Grants R305D210045 and R305D240032 to the University of Kansas Center for Research, Inc., ATLAS. The opinions expressed are those of the authors and do not represent the views of the the Institute or the U.S. Department of Education.

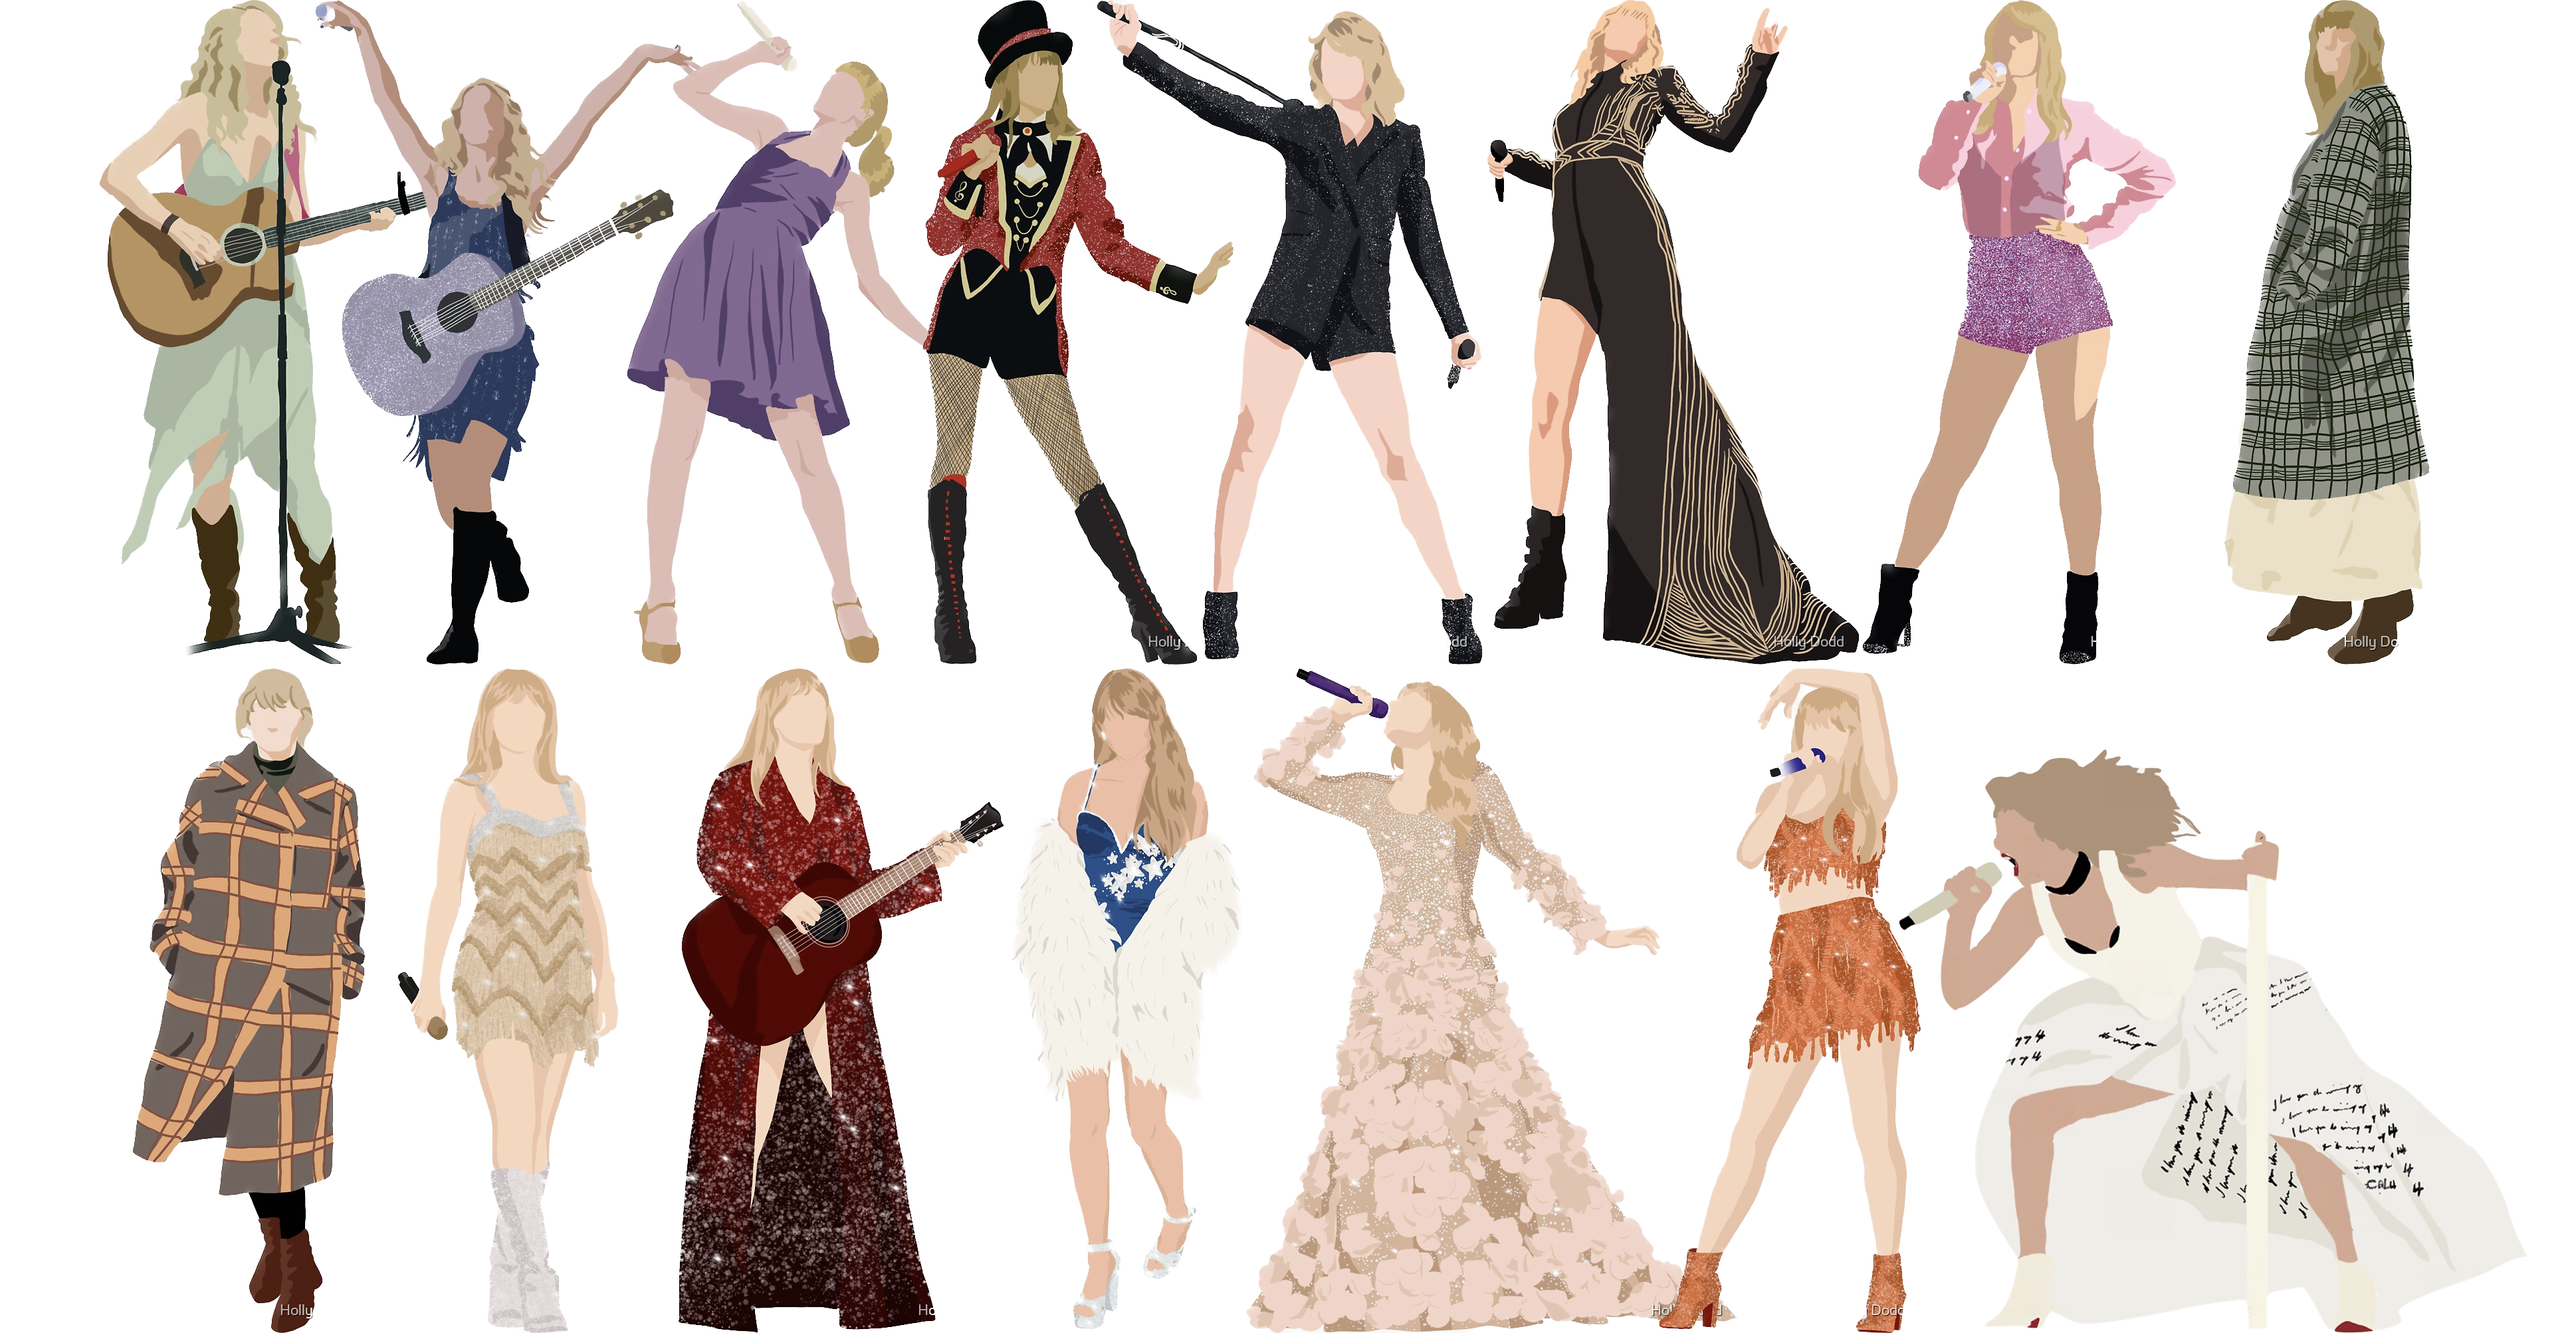
- Traditional assessments and psychometric models measure an overall skill or ability
- Assume a continuous latent trait
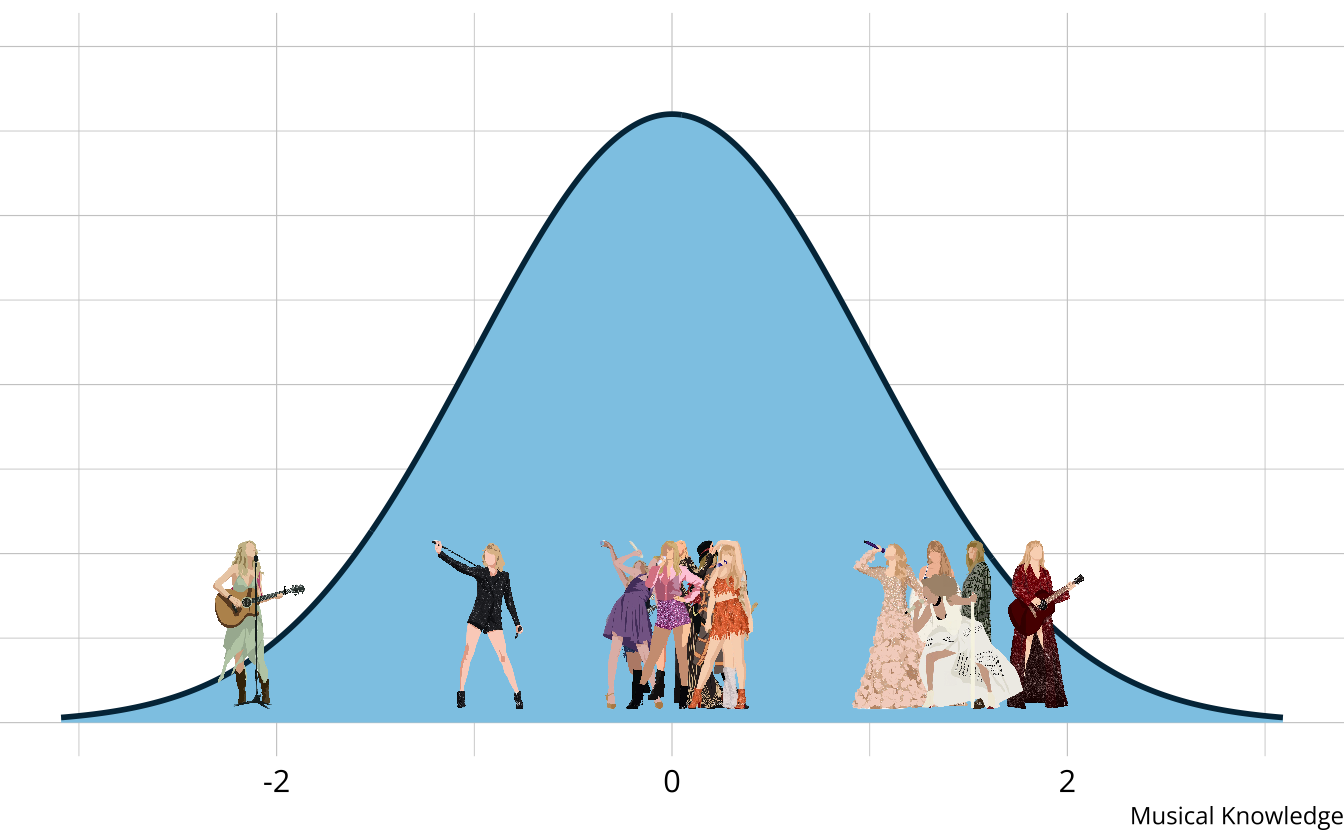
- The output is a weak ordering due to error in estimates
- Confident Taylor Swift (debut) is the worst
- Not confident on ordering toward the middle of the distribution
- Limited in the types of questions that can be answered.
- Why is Taylor Swift (debut) so low?
- What aspects do each era demonstrate proficiency or competency of?
- How much skill is “enough” to be competent?
Diagnostic music assessment
- Rather than measuring overall musical knowledge, we can break music down into set of skills or attributes
- Songwriting
- Production
- Vocals
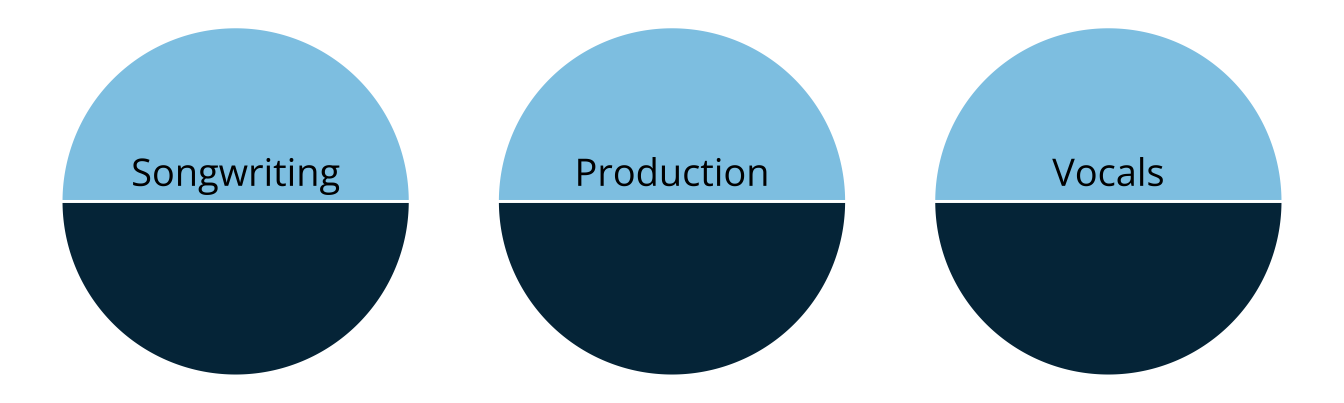
- Attributes are categorical, often dichotomous (e.g., proficient vs. non-proficient)
Diagnostic classification models
- DCMs place individuals into groups according to proficiency of multiple attributes
| songwriting | production | vocals | |
|---|---|---|---|
 |
|||
 |
|||
 |
|||
 |
Benefits of DCMs
- Fine-grained, multidimensional results. Answer more questions:
- Why is Taylor Swift (debut) so low?
- Subpar songwriting, production, and vocals
- What aspects are albums competent/proficient in?
- DCMs provide classifications directly
- Why is Taylor Swift (debut) so low?
- High reliability with fewer items
- Less information need to classify than to place precisely along a scale
| songwriting | production | vocals | |
|---|---|---|---|
|
|||
|
|||
|
|||
|
Applications in educational assessment
-
Dynamic Learning Maps®
- Achievement assessment for students with the most significant cognitive disabilities
- Currently used by 24 states for accountability reporting to the U.S. Department of Education
-
Pathways to Instructionally Embedded assessment
- Competitive Grant for State Assessment award from the U.S. Department of Education
- Partnership between ATLAS and the Missouri Department of Elementary and Secondary Education

Thompson & Clark (2024): Improving instructional decision-making using diagnostic classification models
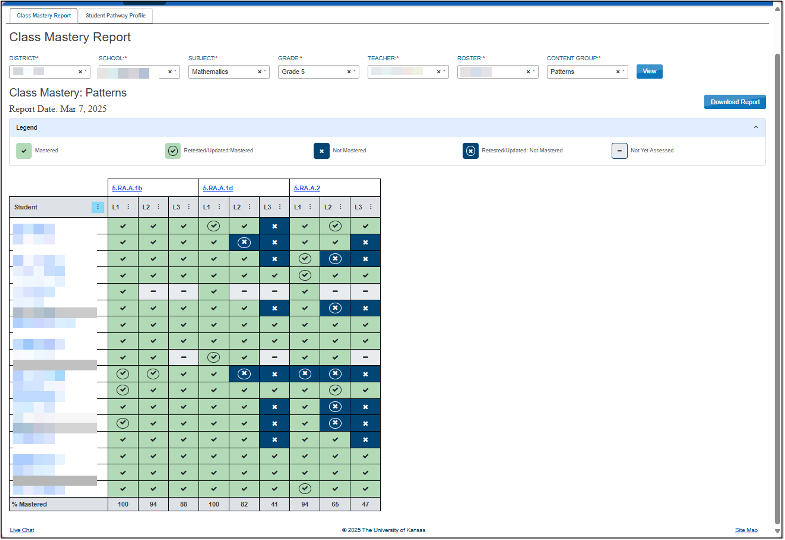
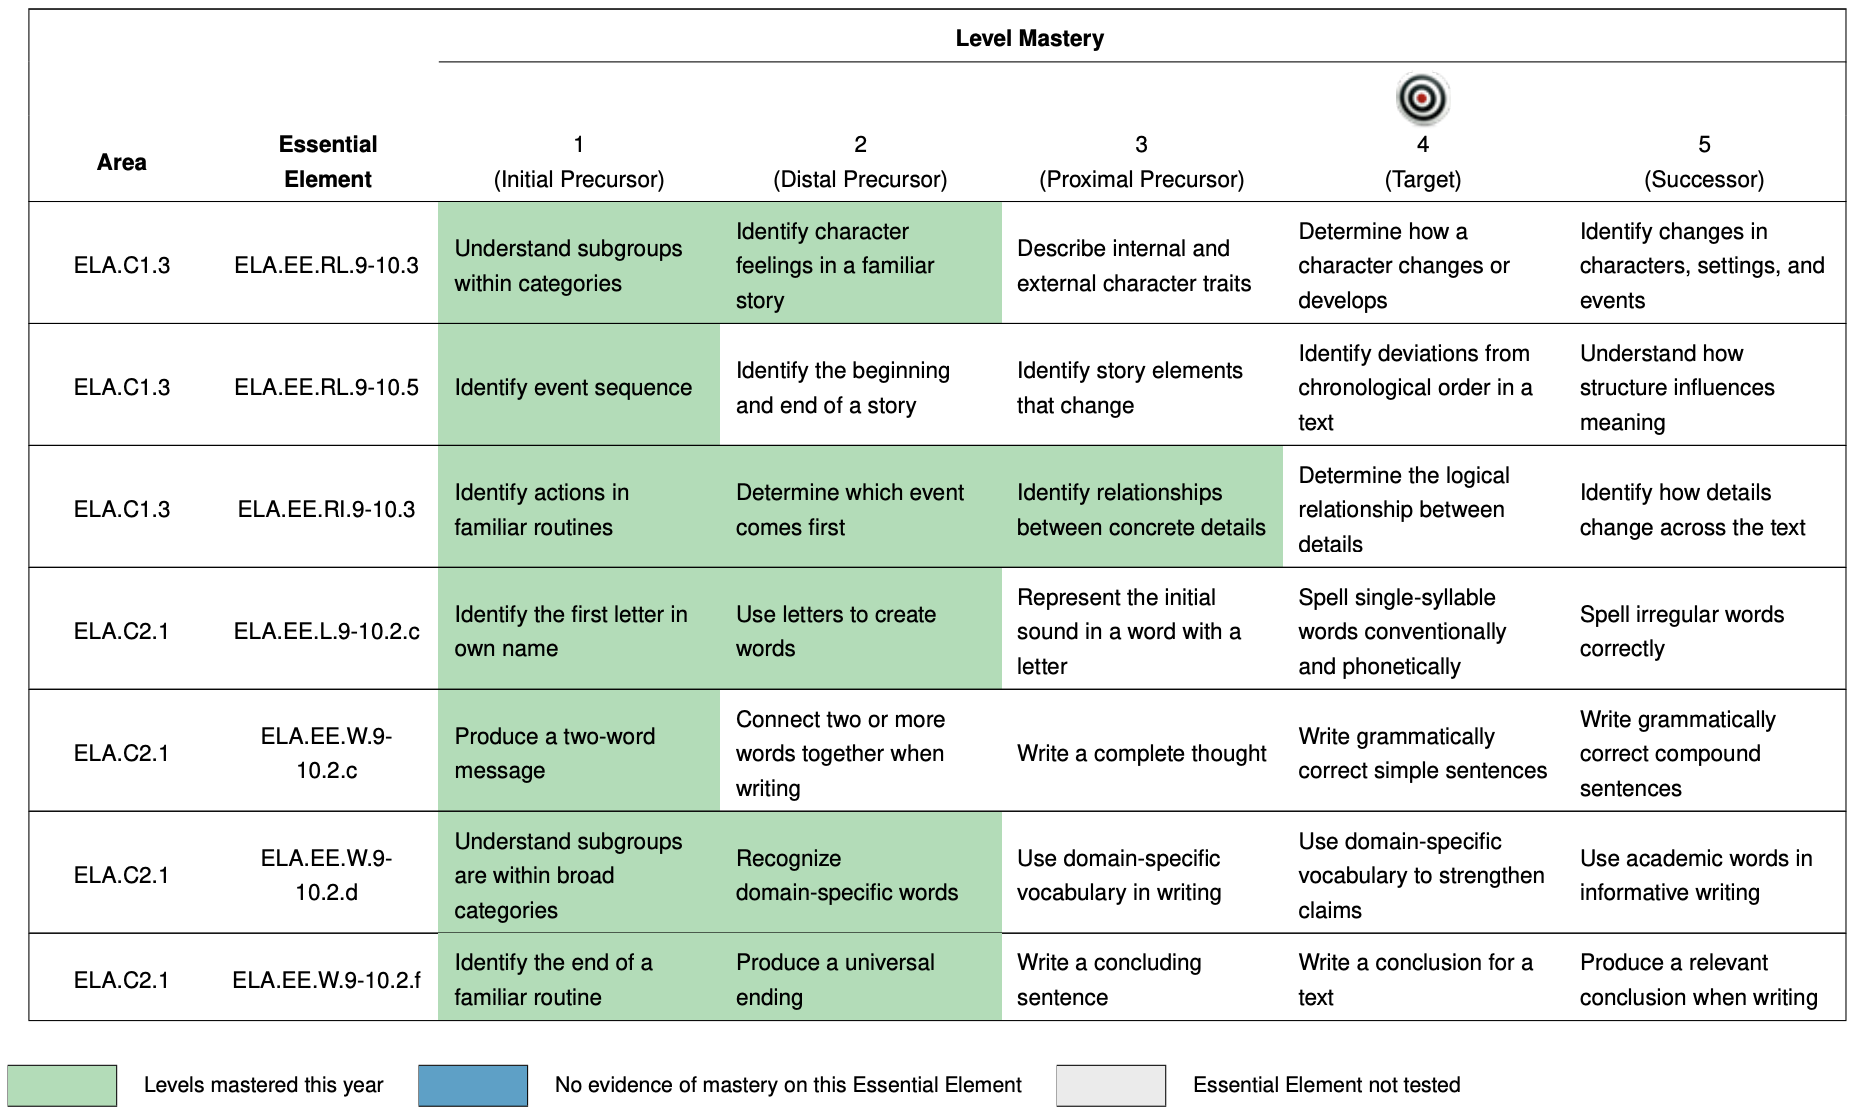
DLM reporting
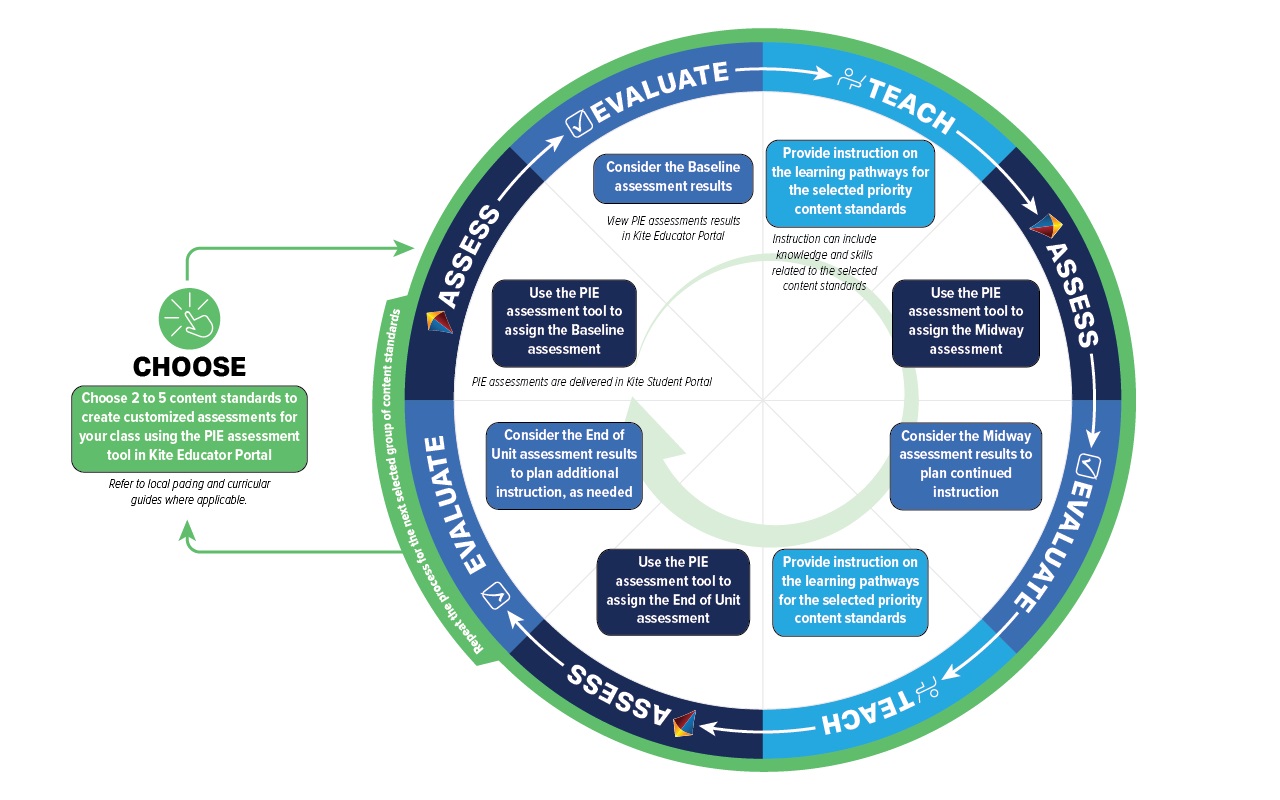
PIE instructional cycle
PIE reporting
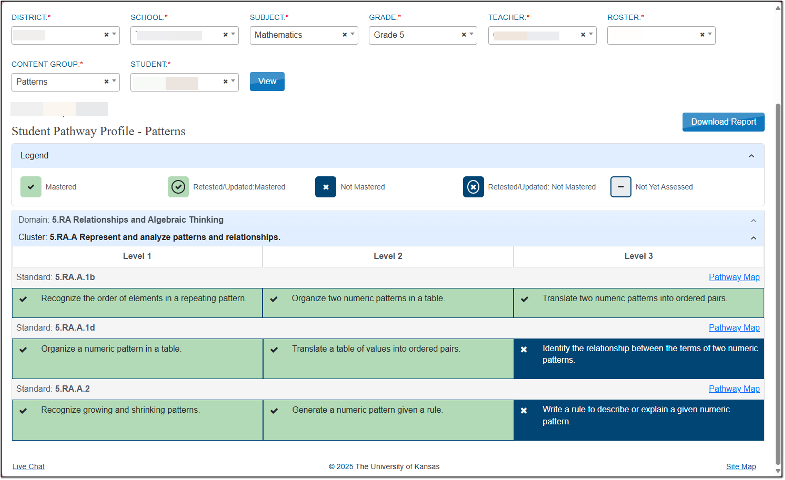
PIE reporting